Calculate Gamma values for a window moving through the data.
Usage
moving_window_search(
  predictors,
  target,
  window_size = 40,
  by = 1,
  plot = TRUE,
  caption = "",
  show = "Gamma"
)
Arguments
- predictors
A Numeric vector or matrix whose columns are proposed inputs to a predictive function
- target
A Numeric vector, the output variable that is to be predicted
- window_size
Integer width of the window that will move through the data
- by
The increment between successive window starts
- plot
Logical, set this to FALSE if you don't want the plot
- caption
Character string, caption for plot
- show
Character string, if it equals "vratio", vratios will be plotted, otherwise Gamma is plotted
Value
An invisible data frame containing starting and ending positions of each window with its associated gamma
Details
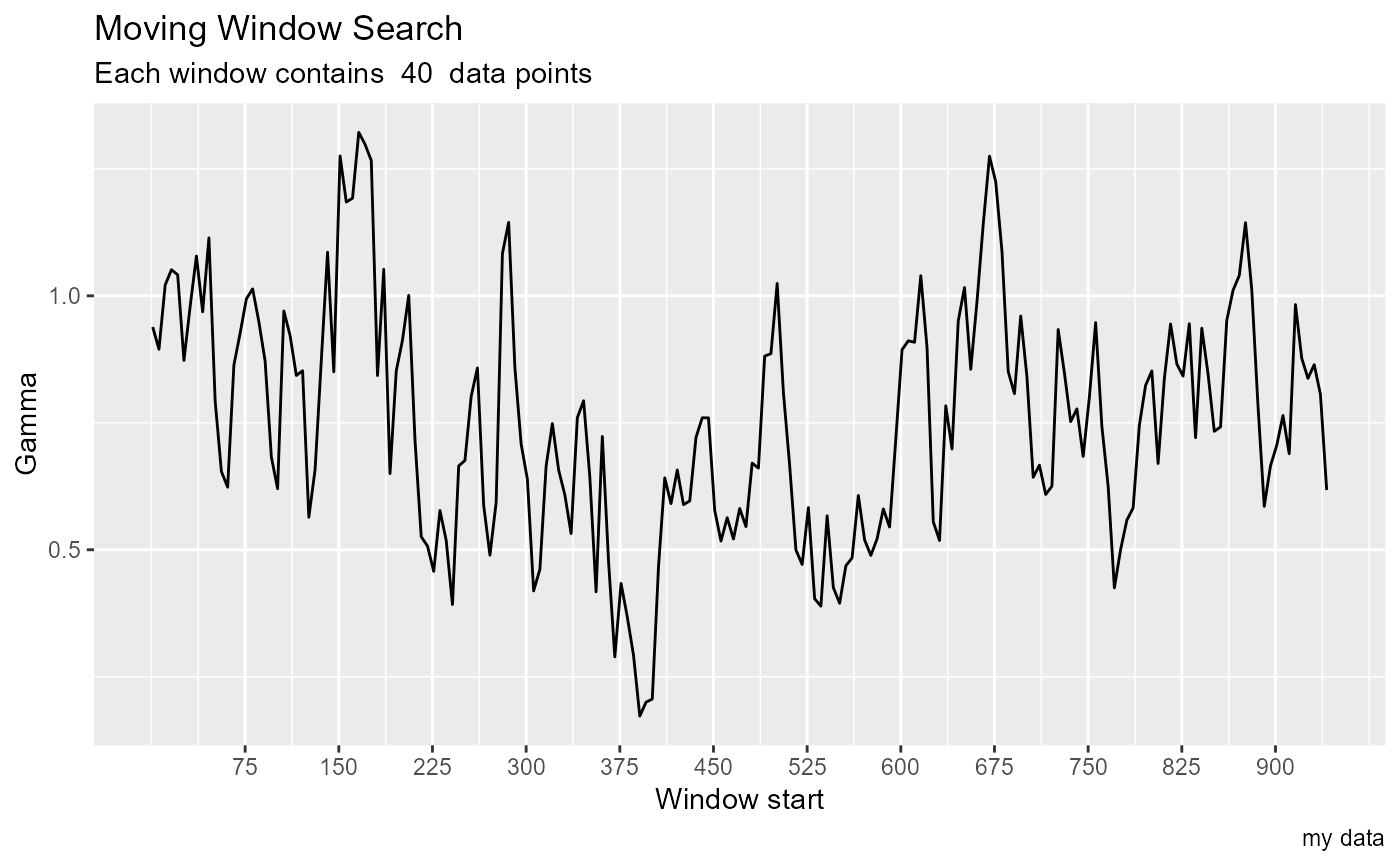
This is used for data sets that are ordered on one or more dimension, such as time series or spatial data. The search slides a window across the data set, calculating gamma for the data at each step. A change in causal dynamics will appear as a spike in gamma when the causal discontinuity is in the window.
Examples
he <- embed(henon_x, 13)
t <- he[ , 1]
p <- he[ ,2:13]
moving_window_search(p, t, by = 5, caption = "my data")