Increasing Embedding Search engine, used by get/plot increasing_search
Source:R/increasing_search.R
increasing_search.RdAdds variables one at a time to the input set, to see how many are needed for prediction.
Arguments
- predictors
A vector or matrix whose columns are proposed inputs to a predictive function
- target
A vector of double, the output variable that is to be predicted
- plot
Logical, set plot = FALSE if you don't want the plot
- caption
Character string to identify plot, for example, data being plotted
- show
Character string, if it equals "vratio", vratios will be plotted, otherwise Gamma is plotted
Value
An invisible data frame with three columns, Depth of search, from 1 to ncol(predictors), Gamma calculated using columns 1:Depth as predictors, and vratio corresponding to that Gamma (Gamma / var(target))
Details
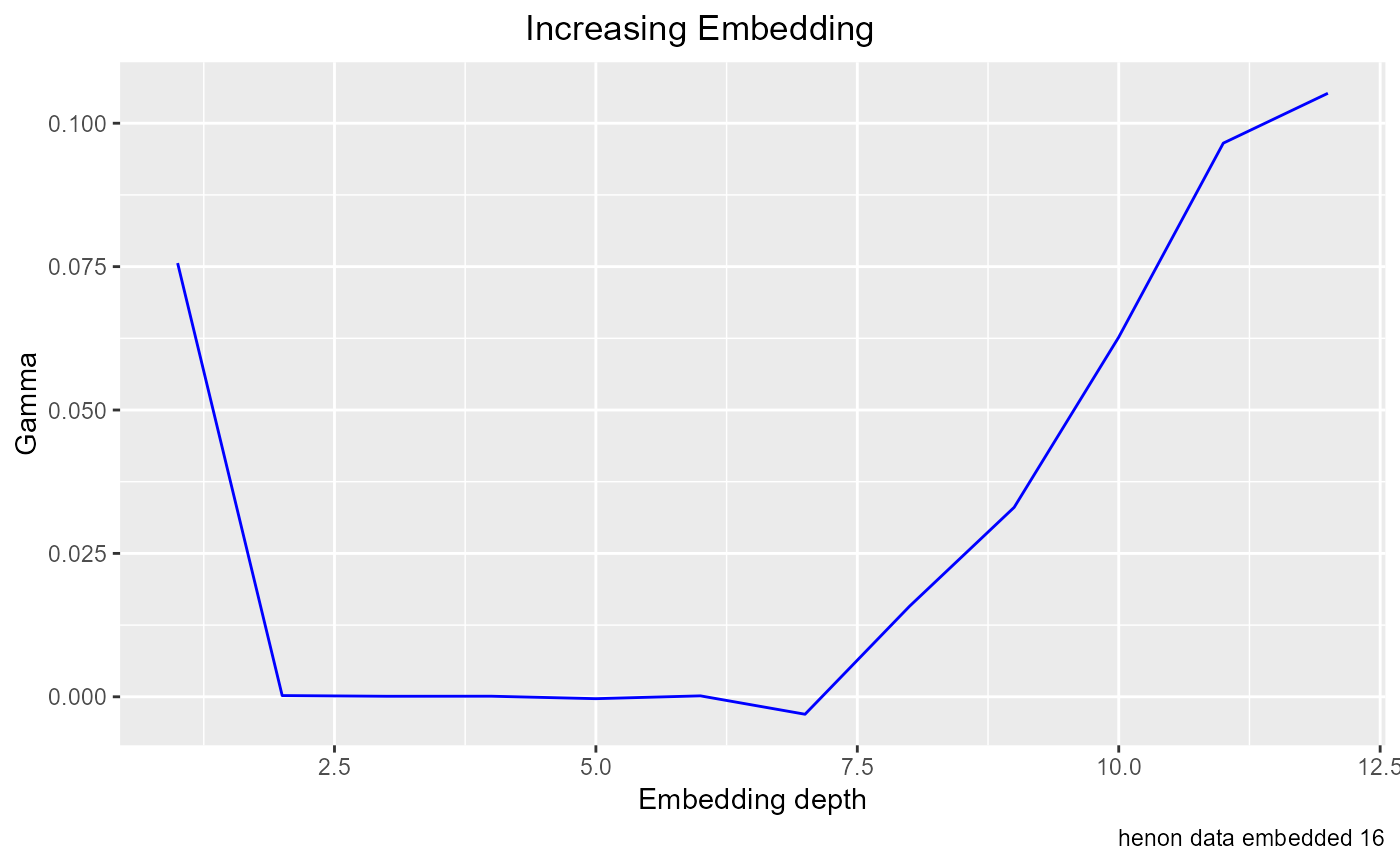
An increasing embedding search is appropriate when the input variables are ordered, most commonly in analyzing time series, when it's useful to know how many previous time steps or lags should be examined to build a model. Starting with lag 1, the search adds previous values one at a time, and saves the resulting gammas. These results can be examined using plot_increasing_search()
Examples
he <- embed(henon_x, 13)
t <- he[ , 1]
p <- he[ ,2:13]
increasing_search(p, t, caption = "henon data embedded 16")

df <- increasing_search(predictors=p, target=t, plot = FALSE)