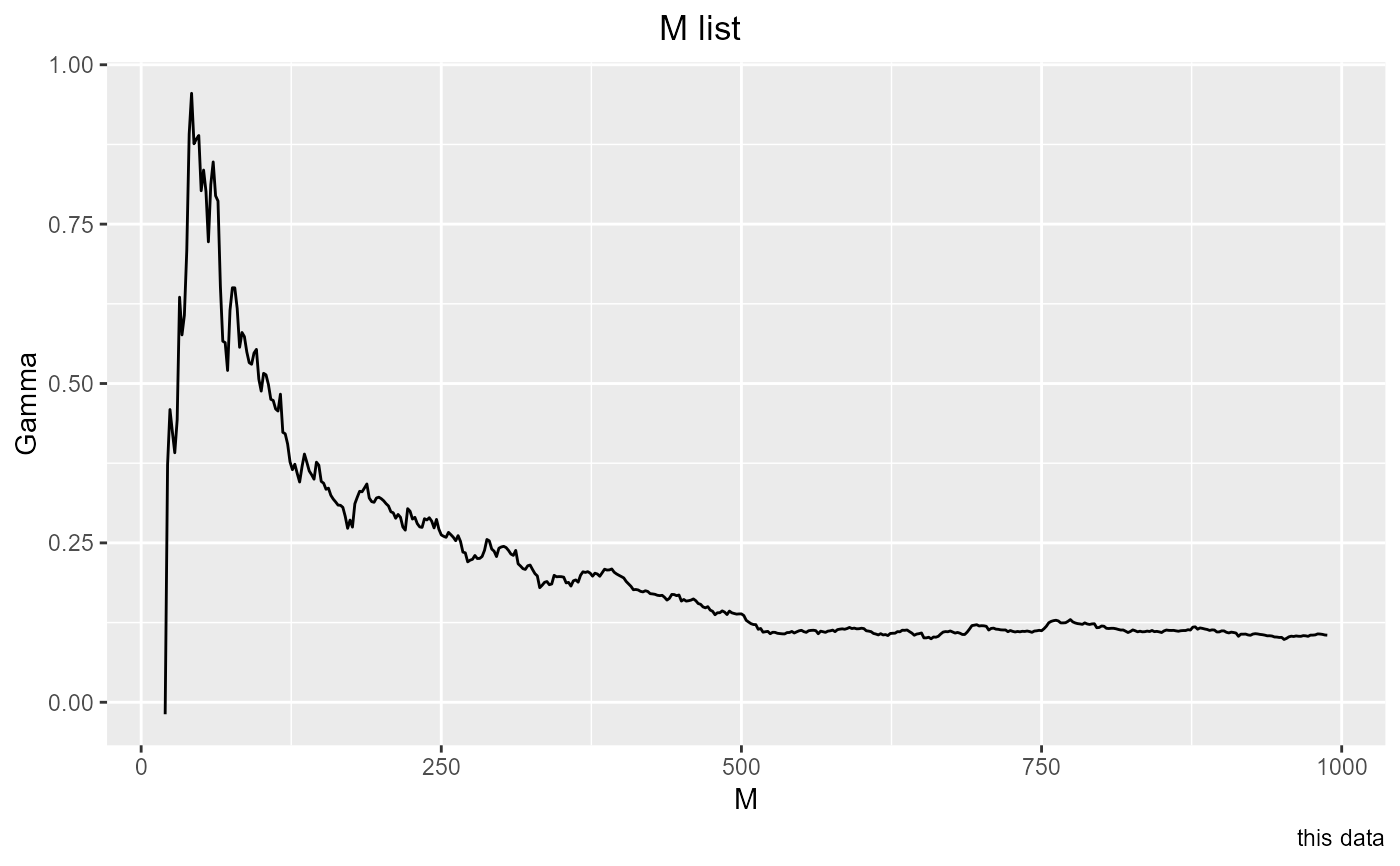
Investigates the effect of sample size by calculating Gamma on larger and larger
samples. Gamma will converge on the true noise in the relationship as sampling
density on the function increases. get_Mlist produces a showing M values
(sample sizes), and the associated Gammas and vratios. It produces a graph by
default, and also returns an invisible data.frame. The successive samples are
taken starting at the beginning of the inputs. There is no option to sort
the input data; if you want the data to be randomized, do that before calling
get_Mlist. The graph will become stable when the sample size is large enough.
If the M list does not become stable, there is not enough data for either the
Gamma test or a successful smooth model.
Usage
get_Mlist(
  predictors,
  target,
  plot = TRUE,
  caption = "",
  show = "Gamma",
  from = 20,
  to = length(target),
  by = 20
)
Arguments
- predictors
A Numeric vector or matrix whose columns are proposed inputs to a predictive relationship
- target
A Numeric vector, the output variable that is to be predicted
- plot
A logical, set this to FALSE if you don't want the plot
- caption
Character string to be used as caption for the plot
- show
Character string, if it equals "vratio", vratios will be plotted, otherwise Gamma is plotted
- from
Integer length of the first data sample, as passed to seq
- to
Integer maximum length of sample to test, passed to seq
- by
Integer increment in lengths of successive windows, passed to seq
Value
An invisible data frame with three columns: M (a sample size), Gamma and the associated vratio. This is ordered by increasing M.
Examples
he <- embed(henon_x, 13)
t <- he[ , 1]
p <- he[ ,2:13]
get_Mlist(p, t, by = 2, caption = "this data")