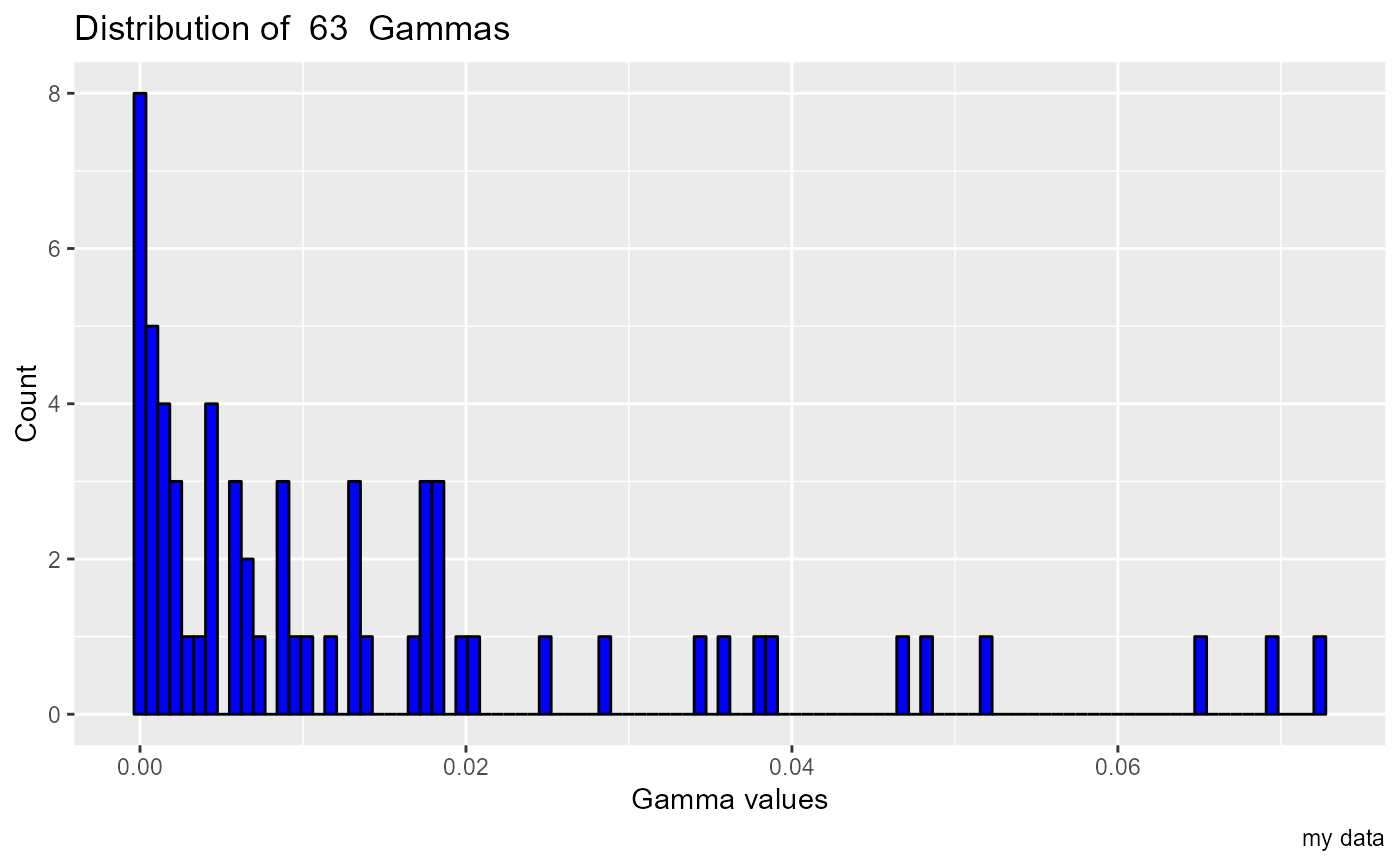
Produces a histogram showing the distribution in a population of Gamma values, used to examine the result of a full embedding search. Pass the result of fe_search() to this function to look for structure in the predictors. For example, it this histogram is bimodal, there is probably one input variable which is absolutely required for a good predictive function, so the histogram divides into the subset containing that variable, and the others that don't.
Arguments
- fe_results
The result of fe_search or full_embedding_search. A matrix containing a column labeled Gamma, of Numeric Gamma values. It also contains an integer column of masks, but that is not used by this function.
- bins
Numeric, number of bins in the histogram
- caption
Character string caption for the plot